Know when a site goes down, a job doesn't run, a certificate is about to expire, or a domain is about to expire.
Pingstack watches your cron jobs, websites, certificates and DNS, and tells the right person by phone call, Slack, Teams or email. Free for 15 checks.

- No card needed
- Setup takes one line in your job
- Checks run from US East, EU West and AP South. See Pingstack's own status page
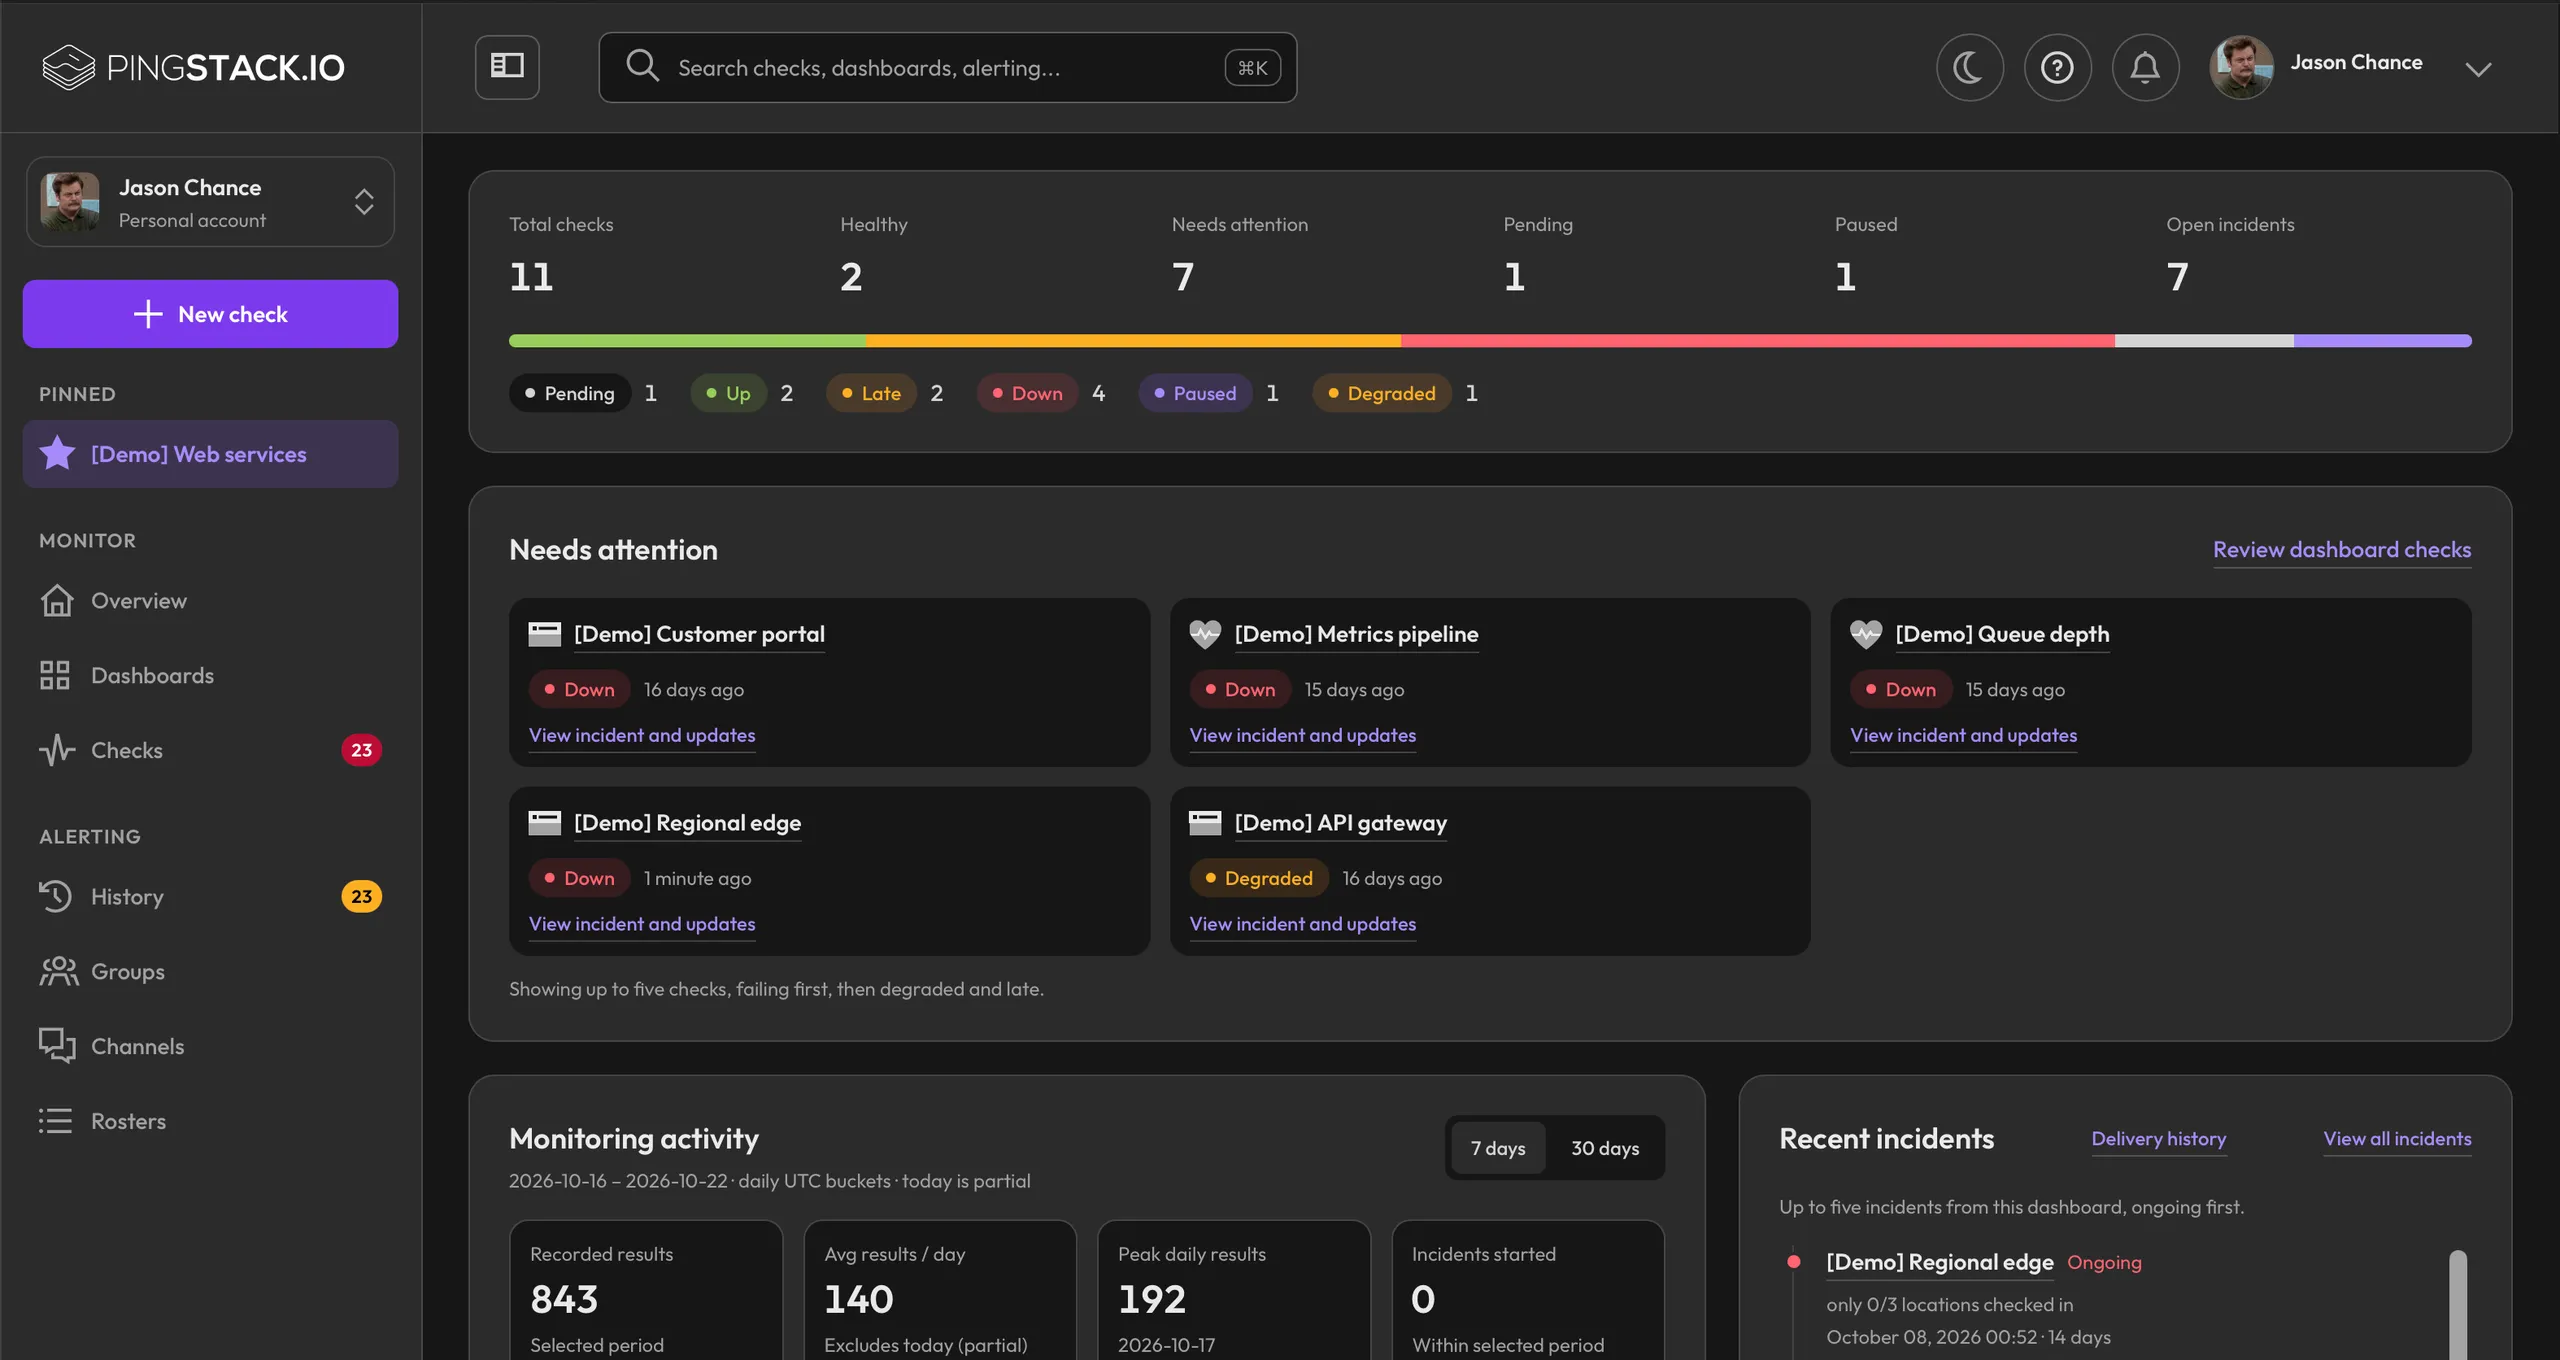
Three steps to your
first check
1. Add a check
Pick a heartbeat for a job, or an address to probe.
2. Wire it in
Add the ping URL to the end of your job, or let your AI agent do it over MCP.
3. Choose who hears about it
Route alerts to a notification group by phone call, Slack, Teams, Discord, email or webhook, or open a Jira issue.
Six kinds of checks
in one dashboard
Cron jobs and scheduled tasks
Your job pings a URL when it finishes. If it misses the schedule plus a grace period, you hear about it. It can also send a number with the ping (rows processed, backup size), and you'll get a warning when it crosses a threshold. Cron job monitoring
Websites and APIs
We check them from up to three regions, as often as every minute on Pro and Team and every 30 seconds on Business. Website monitoring
SSL certificates
You get a warning a set number of days before a certificate expires, so a failed auto-renewal shows up long before your users see it. SSL monitoring
Domains
Every domain sits in one list, and you hear about it well before a registration lapses. Domain monitoring
DNS records
We compare your records across the Cloudflare, Google and Quad9 resolvers, so you see a change before your users do. DNS monitoring
TCP ports
Find out when a database, mail server or SSH port stops accepting connections. TCP port monitoring
Built for the team
that runs everything
Alerts that reach the right person
Send each check to a notification group, and let rosters decide who's on duty this week. Outages wake the on-call person with a phone call, and everyone else gets a Slack or Teams message. If one of our probe regions is having trouble, we hold the alert so you don't get paged for our problem.

A status page with your name on it
Share any dashboard publicly with your logo, colors and light or dark theme, or put it on the office TV as a wallboard.
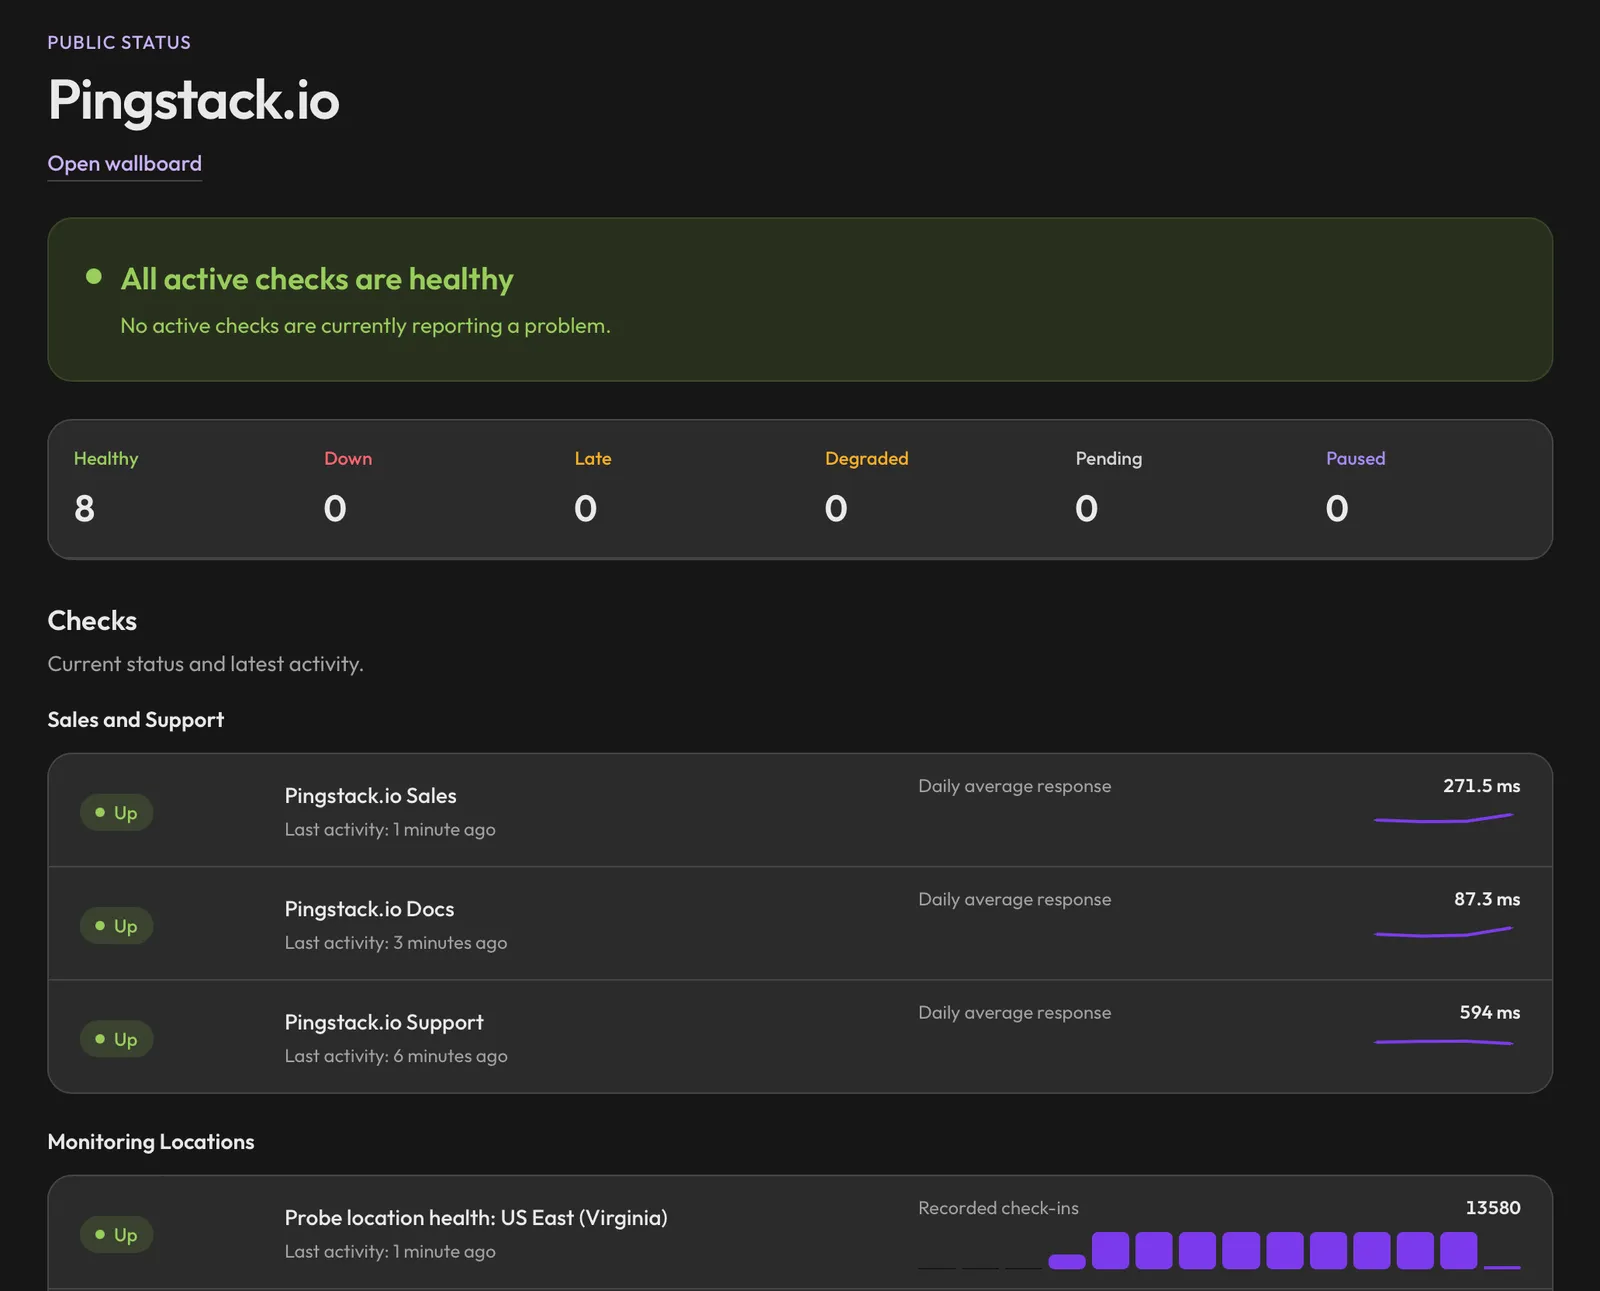
Your AI agent can set it up
Connect Claude Code, GitHub Copilot, Cursor, Codex or Antigravity with a browser sign-in. Ask it to add a heartbeat for every new job, put it on a dashboard or sum up last week's incidents. It stays inside your plan limits and your role's permissions.
Common questions
What can I monitor?
Cron jobs and scheduled tasks (heartbeat checks), websites and APIs, SSL certificates, domain expiry, DNS records and TCP ports. Every check type is on every plan.
How do heartbeat checks work?
Each check has a unique ping URL. Your job calls it when it finishes. If that call doesn't show up within the schedule (an interval or a cron expression) plus a grace period, Pingstack opens an incident and alerts your notification group.
Where do alerts go?
To notification groups you set up. They deliver by email, Slack, Microsoft Teams, Discord and webhooks on every plan, through PagerDuty, Jira Service Management and Jira tickets on Team and Business, and by phone call on paid plans (SMS coming soon). Rosters decide who's on duty. Need something else? Connect Zapier.
What does the free plan include?
15 checks of any type, website checks every 5 minutes from 1 probe region, 1 status page, and every alert integration except phone calls, PagerDuty and Jira. There's no time limit. Compare plans